What Makes The Columbia River Basin Unique and How We Benefit
Overview
The Columbia River is the fourth largest river in North America. Originating in British Columbia, it flows 1,214 miles to the Pacific Ocean near Astoria, Oregon. Size, however, is only one aspect of what makes the river particularly unique. Uniqueness is also evident by looking at the Columbia River Basin. The Basin’s geologic history, topography and hydrologic cycle provided settlers with an abundance of natural resources. Precious metals, fertile soils and abundant forests are part of the story. So is the abundance of fish and wildlife within the area. With mankind’s ability to tap into these natural resources, Northwesterners have taken advantage of opportunities to improve their quality of life and economic well-being.
This section describes some of the benefits which stem from society’s interaction with the Columbia River Basin. These benefits include clean, renewable, low cost and reliable electricity, flood control, irrigation, navigation and recreation. The reason for focusing on these benefits, unlike forestry and mining, is that they relate most directly to society’s use of the Federal Columbia River Power System.
Before looking at these benefits, let’s first take a closer look at how the Basin was formed and nature’s continuing interaction with it. Within the Basin, there are 2,500 square miles of waterways and lakes. The Columbia River and its tributaries account for about 219,000 sq. miles of drainage in seven western states. This drainage occurs within the context of an intricate relationship between the hydrologic cycle and the resulting water that flows through the topography of the region. Understanding this relationship and how people have chosen to interact and influence it is critical to understanding both the past and future development of the Northwest.
Let’s begin by looking at the topography of the Columbia River Basin. Physically, the Basin consists of the Rocky Mountains to the east and north, the Cascade Range on the west, and the Great Basin to the south. The Columbia River begins its flow through this Basin from Canada’s Rocky Mountain Range and eventually becomes the border between Oregon and Washington. Along the way, the Columbia is fed by a number of major tributaries. The three largest include the Kootenai, the Clark Fork-Pend Oreille and the Snake rivers. Others include the Payette, the Sultan, the Cowlitz, the Santiam and the Willamette. While each of these tributaries has its own unique characteristics, the Columbia River and the Basin represent the larger whole to which they are all connected.
Over millions of years a series of cataclysmic events shaped the Basin’s topography. During the Eocene and Oligocene periods that date back 20 to 50 million years, there were tectonic shifts that helped form mountainous areas and volcanic activity that resulted in floods of molten lava. Seventeen million years ago, scientists believe a giant meteorite struck southeastern Oregon, causing floods of basalt lava. As this lava spilled across the western lowlands, the Columbia Plateau began to form. When the lava cooled and cracked, it formed vertical columns of basalt that are still visible today. These volcanic fires were followed by the deep freeze of the ice age.
The big glaciers of the last ice age covered all the northern fringe of Washington and Idaho. In Washington, these glaciers advanced down the western part of the Okanogan Valley about as far south as Chelan. In Idaho, a finger of the ice sheet came down to Sandpoint, where it blocked the mouth of the Clark-Fork River. In so doing, an ice dam one-half mile high was created.
This ice dam resulted in the creation of Lake Missoula, which was 2,000 feet deep and stretched hundreds of miles into Montana. Approximately the size of Lake Ontario, about 15,000 years ago the dam burst all at once and Lake Missoula was drained. As the resulting flood carved out 50 cubic miles of earth, deep channels were formed and areas such as the Columbia Gorge were further widened and shaped. It dug canyons such as Dry Coulee, Spring Coulee and Moses Coulee in a matter of days. And it formed the Grand Coulee, which is fifty miles long, up to six miles wide and nine hundred feet deep. Learn more about the ice age floods.
Floods also swept into Oregon, covering much of the Willamette Valley. Where Portland stands today, flood waters were thought to be 400 feet deep. Scientists now believe such floods occurred repeatedly as the continental ice sheet came and receded. With all these cataclysmic events, the Northwest’s topography took shape.
As water flows through this topography, the continental divide causes the river system to “tilt” toward the Pacific Ocean. Entering the United States in Western Montana, the continental divide stretches south to the Idaho border. The divide follows this border east into Wyoming and then heads south through Colorado. Rivers west of the divide, such as the Columbia, flow through the region’s topography and toward the Pacific Ocean.
As the water flows to the Pacific, the Columbia River is second only to the Missouri-Mississippi River System in terms of annual run-off. But because of the region’s topography and its gradients, water flows through the Columbia River System like no other river system in the United States. This unique combination and the hydrologic cycle is the reason that over 80% of the Northwest’s renewable electricity comes from hydropower.
The importance of the hydrologic cycle in creating a unique relationship between water flow and topography cannot be underestimated. To the west of the Cascades, precipitation largely falls in the form of rain during the winter. To the east of the Cascade Mountain Range, precipitation largely falls in the form of snow during the winter months. Stored in deep snowpacks found in mountainous areas, spring time warmth is the catalyst for water being released into the river system. This runoff causes rivers to rise and streamflows to peak during May or early June. In fact, 60 percent of natural runoff happens from May through July.
Annual precipitation, of course, is not constant. Nor are variations in sunlight and air temperature. Further, extreme weather due to climate change adds to the variability. So how much a river rises, or if it floods, largely depends on how these variables mix together during the year. By looking at streamflows at the Dalles in Oregon, one can see how much the hydrologic cycle can vary from year to year.
Flow on the Columbia River is generally measured at The Dalles, Oregon. Historic records show an annual pattern with peak flows in the late spring. Source: U.S. Bureau of Reclamation, U.S. Army Corp of Engineers, and Bonneville Power Administration. The Columbia River System: The Inside Story, Portland OR, 1991, p.6
As the hydrologic cycle occurs, 130-million-acre feet of runoff flows through the topography of the Columbia river system annually. By comparison, that is more than eight times the runoff from the Colorado River System.
Technology has been society’s tool for using the power of this relationship between water and topography to maximum advantage. Combined with the Northwest’s other natural resources, such as fertile soil, precious metals and forests, settlers were drawn to the Basin. For instance, population and gross domestic product at the turn of the nineteenth century could be measured in thousands. Today, the Northwest’s population is over 15 million and gross domestic product almost $1 trillion.
In short, the Columbia River Basin is an essential reason for the Northwest being a dynamic and highly prosperous region within the nation and the world. Hydropower, flood control, irrigation, navigation and recreation are specific benefits that the uniqueness of the Basin and its river system provide.
The Columbia River Basin
The map of the Columbia River Basin and text description of the basin are taken from “Columbia River and Tributaries Review Study: Project Data and Operating Limits”, US Army Corps of Engineers, North Pacific Division, CRT 69, July 1989. Both the map and text have been slightly modified from the original source.
How the Hydrologic Cycle Works
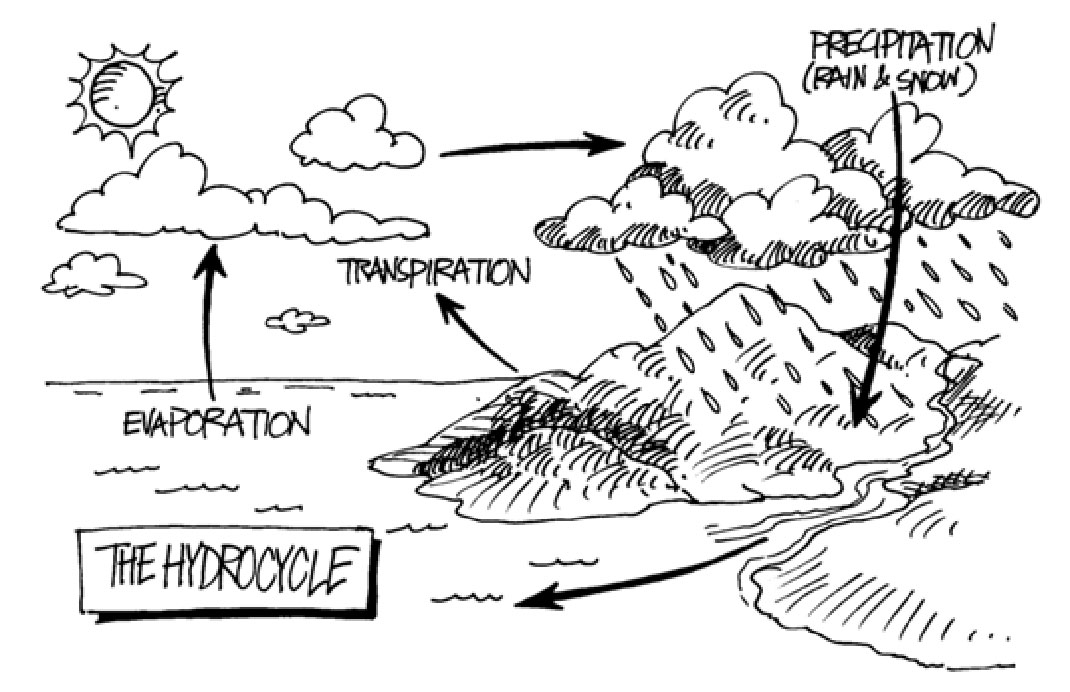
How come we never run out of water? After four and a half million years you’d think the water would be all used up! It’s not, though, because of one special process: the hydrologic cycle, also called “the water cycle.”
This Hydrologic Cycle recycles the earth’s valuable water supply. In other words, the water keeps getting reused over and over. Just think, the next glass of water you drink could have been part of a dinosaur’s bath in the Mesozoic Era one hundred million years ago. Water in that glass of water could have been a liquid, a solid, and a gas countless times over thanks to the water cycle.
The sun is the energy that powers this remarkable process. It’s energy in the form of light, and heat causes water to EVAPORATE from oceans, rivers, lakes and even puddles. “Evaporate” means it turns the water from a liquid to a gas, or “vapor.” Warm air currents rising from the earth’s surface lift this water vapor up into the atmosphere.
When the air currents reach the cooler layers of the atmosphere, the water vapor condenses around and clings on to fine particles in the air. This step is called CONDENSATION. When enough vapor attaches itself to tiny pieces of dust, pollen or pollutants, it forms a cloud. Clouds do not last forever. Old clouds constantly re-evaporate and new ones form, creating ever-changing patterns in the sky.
As the air gets more and more moist, the droplets that form the clouds grow larger and larger. Eventually they will get so big that the swirling atmospheric winds can no longer hold them up. The droplets then fall from the sky as PRECIPITATION. Precipitation can be in the form of rain, snow, sleet or hail depending on other atmospheric conditions such as temperature.
Once the precipitation reaches the ground, several things can happen to it. First, it might be re-evaporated. For instance, we’ve all seen the mist rising off hot roads after a summer shower. If it isn’t re-evaporated, much of the water will become RUN -OFF that goes into streams and rivers as it flows back to the ocean.
Some of the precipitation will be absorbed into the ground. This is called INFILTRATION. Once in the ground, the water can join the earth’s GROUND WATER supply. This is one of the world’s largest storehouses of water. The water could also be absorbed from the ground by the roots of plants.
Another form of evaporation that contributes to the water cycle is TRANSPIRATION. Here, water given off through the pores of plants and animals joins the atmosphere as a vapor. Check, for instance, your own breath on a cold day. What you are seeing is water vapor being given off by your body.
With transpiration and evaporation, the cycle begins again: EVAPORATION, CONDENSATION, PRECIPITATION, RUN-OFF, INFILTRATION, and TRANSPIRATION. Each time a molecule of water goes through the cycle it is cleaned, or purified, so it can be used by plants and animals again tomorrow, next year, and hopefully forever.
Hydropower
Over 50% of the electricity in the Northwest is produced by hydropower. Historically, hydropower has provided the most abundant, clean, renewable, low cost, and reliable source of electricity in the region. The Northwest is home to over 370 hydropower projects.
This source of inexpensive electricity was a major attraction for energy intensive industries such as aluminum, food processing, and the production of plutonium for national defense. Other industries, such as aerospace, were attracted to this area because they wanted proximity to a resource, in this case aluminum, being manufactured in the Northwest. In addition, the mining industry was a major beneficiary because inexpensive electricity greatly reduced the costs of extracting various metals.
Individuals benefited as well. For instance, hydropower was the first source of electricity for many rural areas. Further, the cost of owning and maintaining a more comfortable home was less. Specifically, inexpensive electricity meant installing electric heaters, dryers, stoves and other appliances was in easy reach of the many, not the few.
Today, electricity demand for high-tech manufacturing, data centers supporting world-wide cloud computing, and a growing population continue to make low-cost, reliable electricity a critical need. And because the need for clean, renewable energy to lessen the effects of climate change is urgent, hydropower remains as or more important than ever for the Northwest.
Flood Control
Historically, the two priorities for coordinated management of the Columbia River system have been electric generation and flood control. Other priorities, such as irrigation, navigation and recreation, are largely carried out within the context of meeting these needs. Since the 1990s, listing some salmon as endangered species has resulted in anadromous fish recovery being added as a priority.
Understanding the importance of flood control is similar to understanding the importance of insurance. Until you lose something, you do not appreciate how important it is. In 1948, the importance of flood control became a priority after Vanport, Oregon was destroyed by a flood. The Army Corps of Engineers responded by developing a multiple-use reservoir storage plan for the Columbia River Basin.
The Columbia River Treaty with Canada and the evolution of sophisticated planning and interagency cooperation have resulted in up to 39.7 million acre-feet of storage space being available for flood control. That is enough water to cover the Northwest four inches deep in water. For the Columbia River Basin, the need for reservoir space to help reduce the risk of flooding is most important during two seasons of the year: in winter, when there are rain-induced floods, and in the spring when there are floods from snowmelt and rain.
By adjusting the amount of water in reservoirs throughout the Basin, system operators are able to create a balance between releasing water to produce hydropower when it is most needed and reducing the potential for flooding. Looking at average river flows at the Dalles Dam over the course of the year is one way to see the difference between unrestricted water flow and the use of reservoirs to make this flow more constant. Further, reservoir storage is also assisted by a system of levees, flood walls, bank protection, and various types of land use regulation.
The U.S. and Canada are negotiating to modernize the Columbia River Treaty to support eco-system management objectives for fish, wildlife, water quality and other environmental needs.
Source: Northwest Power Planning Council. Fourth Northwest Power Plan, Portland OR, March 13, 1996, p.4-5
Forty-eight years of developing this coordinated approach came together as never before in February, 1996. Heavy rains and melting snowpack due to mild temperatures created the worst flooding in over 30 years in the Northwest. Government agencies and non-federal hydro operators worked together to reduce flood damage by an estimated 3.2 billion dollars. Because the Northwest had a flood control plan in place, the evening news did not show downtown Portland six feet deep in water. Some of the details of how the flood of 1996 was contained are remarkable.
Flood of ’96
In February, 1996 an estimated 3.2 billion dollars in flood damage was avoided by government agencies and non-federal hydro operators working together. The Army Corps reacted by orchestrating reservoir releases at regional dams, including Grand Coulee. This action, in concert with Canadian authorities, significantly reduced water flows into the Columbia and thus avoided a much larger disaster.
To do this without interrupting electrical service was no small task. The Grand Coulee Dam went from generating 4300 megawatts to 1300 megawatts of power. In less than six hours, the Bonneville Power Administration found about 1400 megawatts of power from other sources. In dollar terms, Bonneville spent five million dollars to purchase additional power while at the same time losing five million dollars in foregone sales.
The Willamette Valley dams, although controlling only 27 percent of the water in their Basin, were able to reduce river levels six feet at the downtown seawall in Portland, seven and one-half feet in Salem and nine feet in Eugene. In Portland, the visual result is that the river crested just two inches below the seawall. As a result, Portland escaped up to 1.1 billion dollars in estimated damages.
In short, the Northwest landscape could have looked like the Midwest flood-plains during the summer of 1993. This flood killed 50 people, made 70,000 homeless and caused 12 billion dollars of damage.
An editorial by The Oregonian highlighted both the value of this flood control plan and the on-going tension of managing the Columbia River Basin to meet the needs of many masters. The editorial remarked that:
“The recent flood is a reminder that flood control remains a central regional priority. Indeed, one can’t argue with a strategy that prevented $3.2 billion in damages, perhaps saved lives and clearly saved more fish than it killed.
“On the other hand, the Corps should not use its sterling flood-control performance last week to procrastinate on its commitments to provide enough stream flow this spring for moving endangered salmon smolt to the sea.
“Even as Northwest citizens offer the Corps a well-deserved ‘bravo,’ they should attach a postscript to the note: P.S.: Take care of the salmon, too.”
Navigation
Every year, the Columbia and Snake Rivers carry over 50 million tons of cargo to and from the Pacific Ocean along a 465-mile waterway. This is another example of technology and coordinated planning leading to the Columbia Basin being put to multiple use. Specifically, a series of eight locks facilitates the passage of ships from the ocean to as far inland as Lewiston, Idaho. These locks are part of the same projects and reservoirs that produce hydropower and help control flooding.
From the ocean to Portland, Oregon and Vancouver, Washington dredging assures that a 40-foot-deep open river channel remains open year-long for ocean-going vessels. This 106-mile segment then connects with a 359-mile segment that extends to Lewiston, Idaho. Within this second segment, a 14-foot-deep channel for barges and other craft is kept open. To maintain this channel depth, maximum and minimum reservoir elevations are set. These elevations are determined within the context of meeting needs for electrical generation, flood control, and the release of water to help fish passage.
Series of 8 Locks
A 40-foot deep channel accommodates large ships 106 miles inland on the Columbia River to Vancouver, Washington. A combination of dams, locks, and dredging keeps a channel of 14 feet open to Lewiston, Idaho on the Snake River, an additional 359 miles upriver.
The locks raise and lower ships between pools on the river, i.e., from below a dam to the pool above it. On the trip from the ocean to Lewiston, Idaho, vessels travel from sea level through eight locks to an elevation of over 700 feet.
Irrigation
Another benefit that stems directly from the unique nature of the Columbia Basin is irrigation. In fact, six percent of the Columbia River Basin’s yearly runoff is diverted to irrigate about 7.8 million acres of land. Much of the water that is diverted eventually finds its way back into the river system. Farmers in arid parts of eastern Washington, northeastern Oregon, and southern Idaho depend on irrigation to support crops such as wheat, corn, potatoes, peas, alfalfa, apples, and grapes.
The Columbia Basin Project, for instance, turned the high desert area of central Washington into another breadbasket for America. The centerpiece is Grand Coulee Dam, which was built primarily as an irrigation project by the Bureau of Reclamation. Water stored behind Grand Coulee Dam in Lake Roosevelt is pumped into Banks Lake. The water then flows through a system of tunnels and canals to irrigate croplands. The project currently irrigates over 670,000 acres of land. The Grand Coulee Dam is also used as a hydroelectric project and has the capacity to generate more electricity than any other hydroelectric project in North America.
Another example is the Minidoka Project along the Snake River. This project uses water from six storage and two diversion dams. Thousands of miles of distribution canals then provide irrigation service to more than 1.1 million acres of farmland.
The Bureau of Reclamation, local irrigation districts and water companies are examples of authorities that regulate how much water is diverted from the river system to support irrigation. Although scheduled locally, the cumulative effect of utilizing water from the river system to support large and small irrigation projects can be quite significant. As a result, those responsible for coordinated management of the river system take these diversions into account when determining reservoir levels, water flows to support fish passage, and other needs.
In addition, the issue of “water rights” is an on-going concern. Water rights determine both who has the legal right to access and use water, and how much water they can use. While contentious at a local and state level, the situation is made even more complex by recognizing that rights and interests far downstream can also be affected. For example, irrigation to support crops upstream can make less water available downstream to support fish passage.
Recreation
Recreation is the last major benefit that will be discussed. This benefit is also somewhat different from the others. When hydroelectric and reservoir storage projects were proposed, more recreation was not the driving force behind their creation. Rather, opportunities for new and additional recreation came with development of a project. Such opportunities were used to meet local and regional needs as well as address impacts caused by construction.
Examples of recreation opportunities that stem from project development include fishing, swimming, waterskiing, picnicking, camping, hiking, rafting, boating and sightseeing. Often, developing and maintaining these opportunities are part of receiving a federal license to develop and operate a project.
The number and diversity of recreational opportunities associated with hydroelectric projects is indeed remarkable. Each year, millions of people take extended vacations, weekend and day trips to access these opportunities.
Updated February 2022